Predictions
Predictions score each customer based on their purchase history and behavior: RFM group, churn risk, purchase probability, predicted revenue, engagement, and cart abandonment risk. The results are written to the profile as regular traits, so you can use them right away in segments, journeys, and message templates.
The section is in the menu under Data → Predictions. All roles with access to analytics can view the page; Administrator and Owner can change settings and start a recalculation.
Turn on predictions
Predictions start calculating once a purchase event is selected.
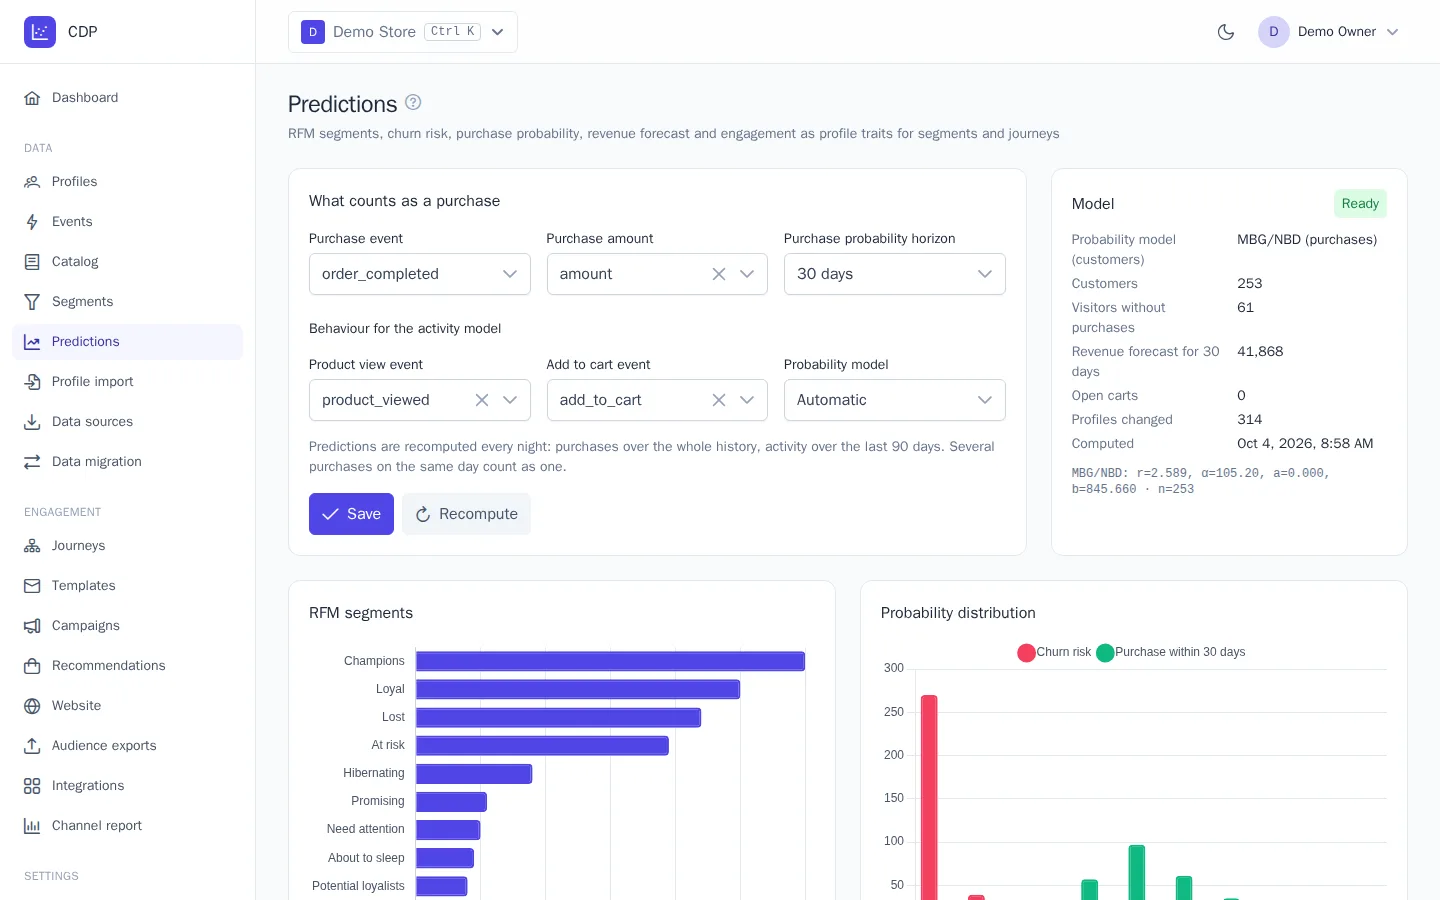
- Open Predictions. If OneTrace.pro finds a likely event (for example,
order_completedwith anamountproperty), a hint appears at the top: click Use it. - In the What counts as a purchase block, choose:
- Purchase event: the event for a placed order;
- Purchase amount: a numeric property with the order total. Without it, total spend, the monetary RFM score, and predicted revenue aren't calculated;
- Purchase probability horizon: 7, 14, 30, 60, or 90 days, the period to predict a purchase for.
- In the Behaviour for the activity model block, set the Product view event and the Add to cart event, if you have them. They make the prediction more accurate, and cart abandonment risk is only calculated when a cart event is selected.
- Leave the Probability model set to Automatic: OneTrace.pro picks the more accurate model for your project.
- Click Save. The first calculation starts right away and usually takes a few minutes.
When predictions are recalculated
Predictions are recalculated every night: purchases are taken from the project's entire history, and activity from the last 90 days. After you change the settings, a calculation starts right away, and the Recompute button starts one manually, for example after an import or a migration of order history.
Traits are assigned to customers and visitors who were active in the last 90 days. Only changed values are written to the profile, and each change can trigger a journey with the Trait changed trigger.
Which traits appear
| Trait | What it means |
|---|---|
rfm_recency, rfm_frequency, rfm_monetary |
1–5 scores for how recent the last purchase was, the number of purchases, and the total spent; 5 is best |
rfm_segment |
RFM group: champions, loyal, at_risk, lost, and others |
purchase_count, total_revenue, last_purchase_at |
number of purchases, their total, and the time of the last one |
churn_risk |
churn risk, from 0 to 1 |
purchase_probability |
probability of a purchase within the selected horizon, from 0 to 1 |
predicted_revenue |
expected revenue from the customer over the horizon (an estimate of customer lifetime value, CLV) |
next_purchase_days |
in how many days the customer is likely to buy again |
engagement_score |
engagement from 0 to 100 based on activity over 30 days; 0 means no visits in 30 days |
last_activity_at, sessions_30d, product_views_30d |
last activity, number of sessions, and product views over 30 days |
cart_abandon_risk |
probability that an item added to the cart in the last 7 days won't be bought; cleared after a purchase |
The full list with explanations is in the Profile traits block at the bottom of the page.
RFM groups
| Group in the interface | rfm_segment value |
Who they are |
|---|---|---|
| Champions | champions |
buy often and recently |
| Loyal | loyal |
regular customers |
| Potential loyalists | potential_loyalists |
recent, bought a second time |
| New customers | new_customers |
one recent purchase |
| Promising | promising |
one fairly recent purchase |
| Need attention | need_attention |
average recency and frequency |
| About to sleep | about_to_sleep |
one purchase, haven't come back in a while |
| Can’t lose them | cant_lose |
used to buy very often but disappeared long ago |
| At risk | at_risk |
bought a lot, but long ago |
| Hibernating | hibernating |
rare, old purchases |
| Lost | lost |
one old purchase |
What the page shows
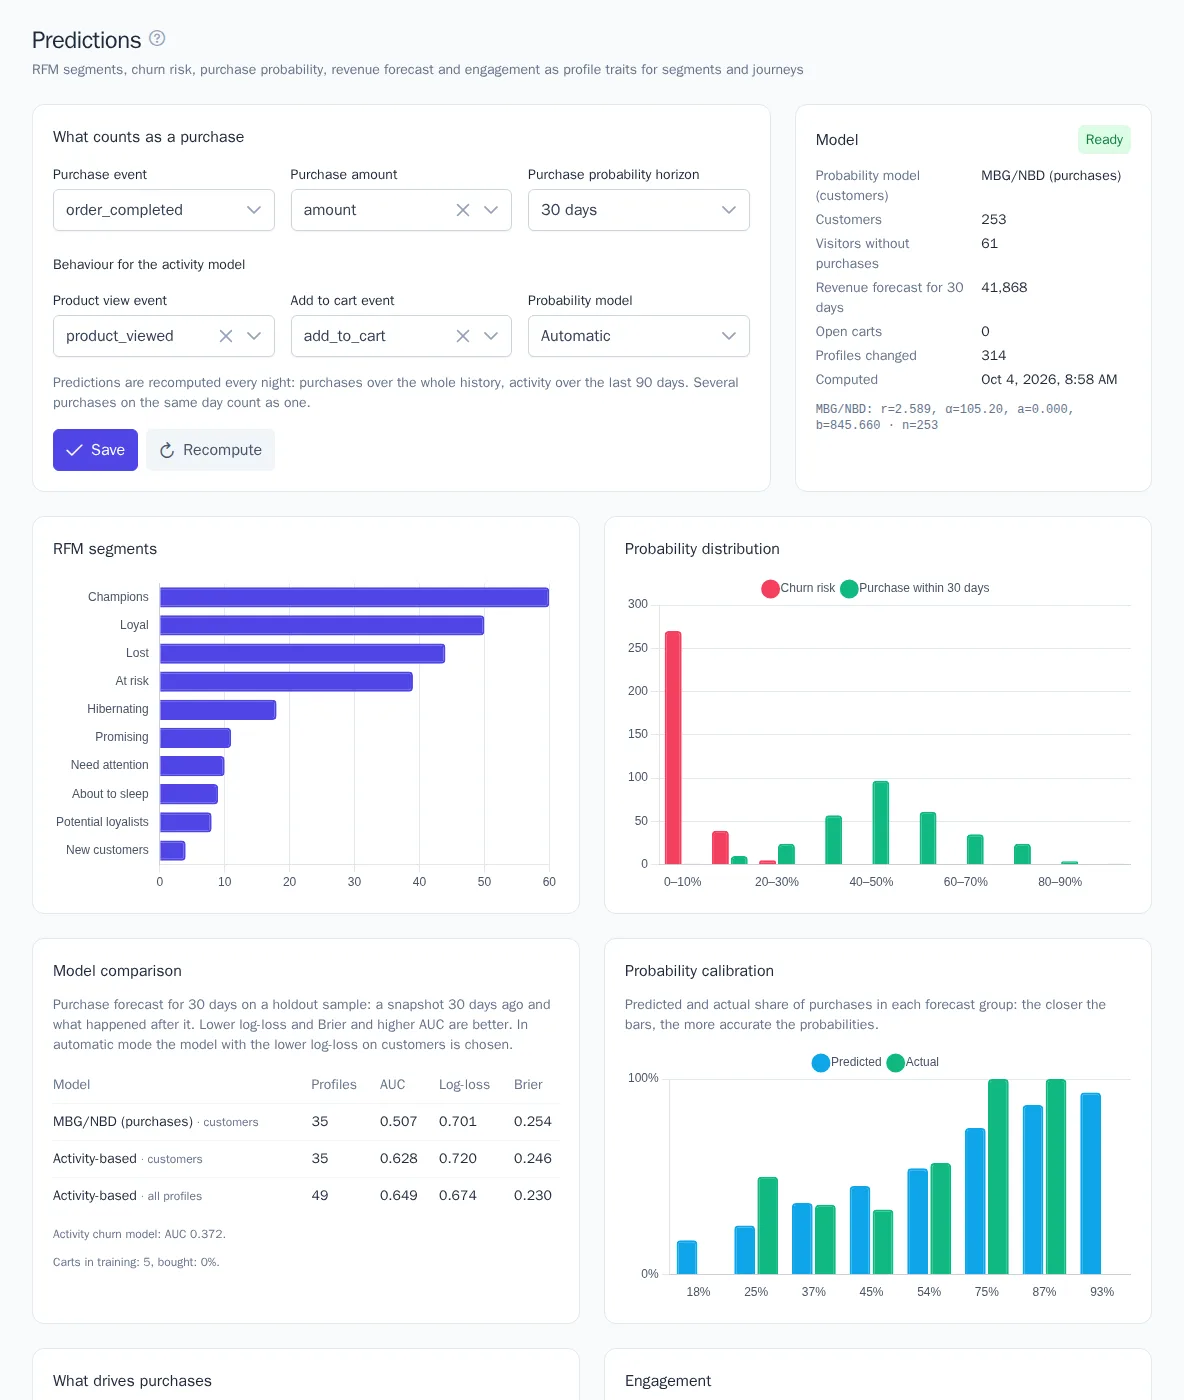
- Model: calculation status, the selected model, the number of customers and of visitors without purchases, predicted revenue over the horizon, the number of open carts, how many profiles changed, and the calculation time.
- RFM segments: how many customers are in each group.
- Probability distribution: how many customers fall into each range of churn risk and purchase probability.
- Engagement: the distribution of
engagement_score.
Model quality
OneTrace.pro checks the prediction against the past: it makes a prediction as of one horizon ago and compares it with what actually happened.
- Model comparison: metrics for the two models on the same customers. AUC shows how well the model separates buyers from non-buyers (0.5 is guessing; closer to 1 is better). Log-loss and Brier show how accurate the probabilities themselves are; lower is better. In Automatic mode, the model with the lower log-loss is chosen, and it's shown in bold.
- Probability calibration: the predicted and actual share of purchases in customer groups. The closer the Predicted and Actual bars, the more you can trust the probabilities in segment rules.
- What drives purchases: which signals raise or lower the purchase probability: active days, an open cart, time since the last purchase, and others.
How to use predictions
In the segment builder, add a Trait condition and choose a prediction trait:
- "Valuable customers slipping away":
rfm_segmentis one ofat_risk,cant_lose, for a win-back journey with a personal discount; - "About to buy":
purchase_probabilitygreater than 0.6; don't give them a discount, a reminder is enough; - "Churn risk":
churn_riskgreater than 0.7 andengagement_scoreless than 20; - "Abandoned cart":
cart_abandon_riskgreater than 0.5.
Prediction traits are also available in journeys (conditions and the Trait changed trigger) and in message templates, for example {{ traits.purchase_probability }}.
Good to know
- Probabilities need history: at least 50 customers, 10 of them repeat buyers, for the purchase model, and at least 200 profiles for the activity model. Until there's enough data, the status is Not enough data, and only RFM scores, counters, and engagement are calculated.
- Several purchases on the same day count as one.
- The model doesn't account for seasonality or promotions: after a sale, probabilities lag behind reality for a while. Use them to compare customers with each other rather than as an exact forecast.
- Returns aren't subtracted from the number of purchases.
- Don't change prediction traits through the API or imports: they'll be overwritten at the next calculation.