Analytics and reports
Analytics shows how your project is doing: how many events and active customers you have, how many messages went out and how they're opened, and which journeys drive conversions. Reports are calculated on the fly from raw data, so there's nothing to set up.
Reports are available to all system project roles: Owner, Administrator, Manager, and User. A journey report also requires access to that journey.
Project analytics on the dashboard
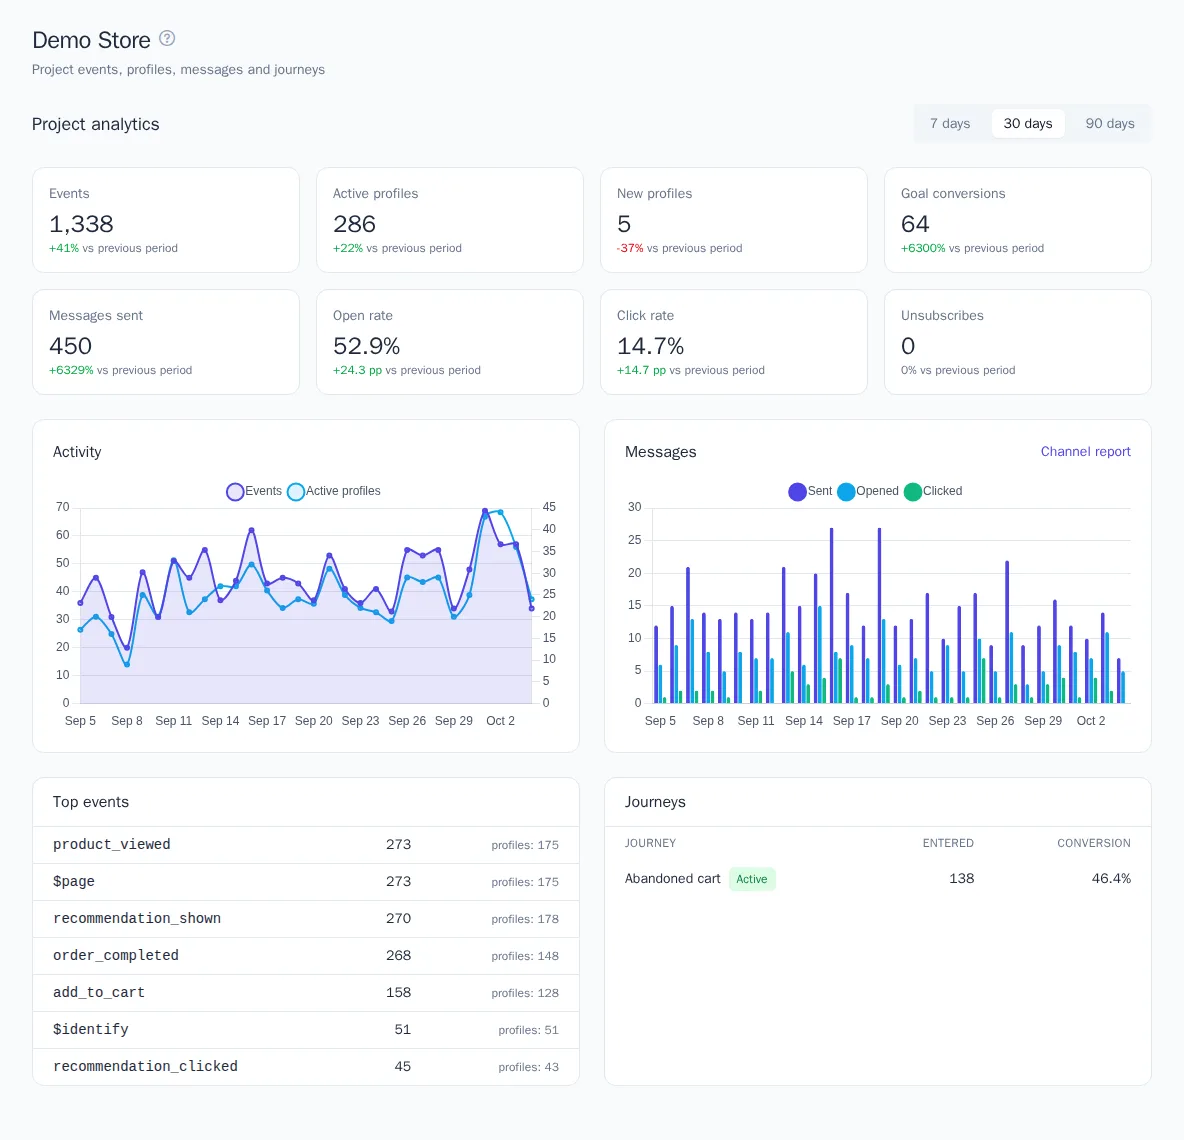
The Project analytics block is on the Dashboard, the first item in the project menu. Choose a period in the top-right corner: 7, 30, or 90 days. The period includes today and is calculated in the project's time zone.
| Metric | What it counts |
|---|---|
| Events | All website, app, and server events, excluding system events |
| Active profiles | Customers with at least one event. Merged profiles count as one |
| New profiles | Profiles that first appeared during the period |
| Goal conversions | Journey participants who reached the goal |
| Messages sent | All channels combined |
| Open rate, Click rate | Share of messages that were opened and that got a click. Repeat opens of the same email aren't counted |
| Unsubscribes | Unsubscribes from channels and topics |
Under each value, you can see the change compared with the previous period of the same length. For rates, the change is shown in percentage points (pp); for unsubscribes, growth is marked as a bad sign. If there was no data in the previous period, you'll see a new label.
Further down the dashboard:
- the Activity chart shows events and active profiles by day;
- the Messages chart shows sent messages, opens, and clicks by day, with a link to the Channel report;
- Top events lists the ten most frequent events and the number of profiles for each;
- Journeys lists the ten journeys with the most entries and their conversion. Click a journey name to open its page with a detailed report.
Dashboard data refreshes every few minutes.
Channel report
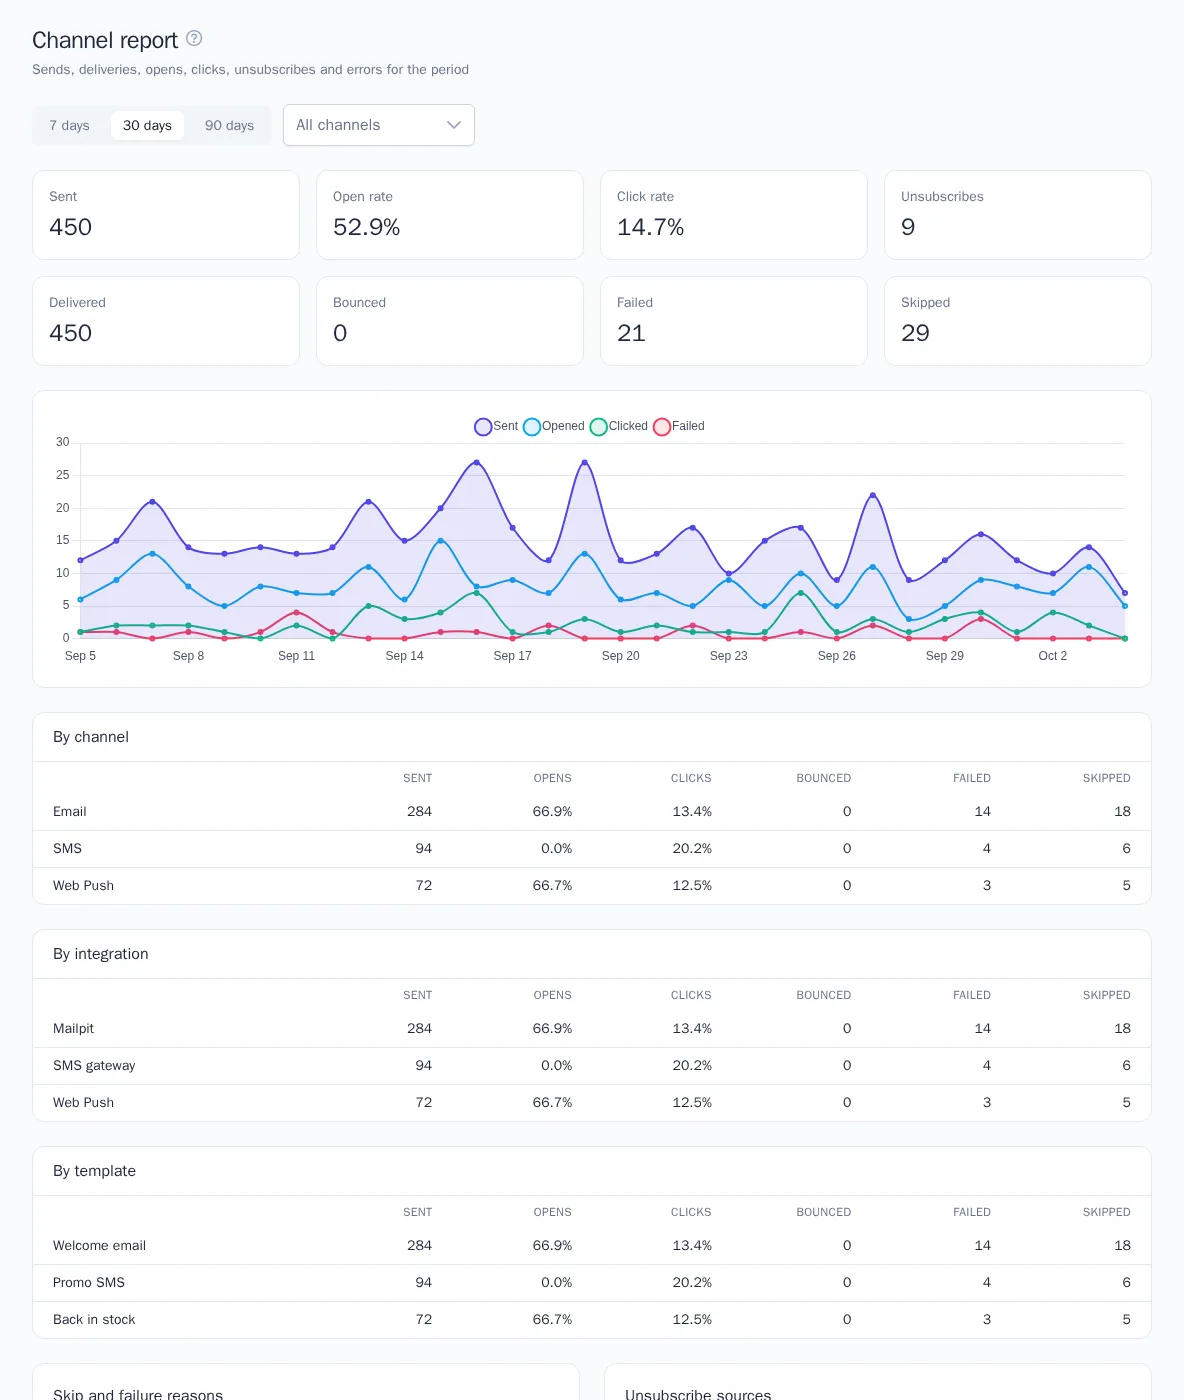
Open Engagement → Channel report. At the top, choose a period and a channel. If you don't choose a channel, the report covers all channels at once.
- Cards: Sent, Open rate, Click rate, Unsubscribes, Delivered, Bounced, Failed, Skipped.
- Daily chart: sent messages, opens, clicks, and failures.
- "By channel", "By integration", and "By template" tables with the columns Sent, Opens, Clicks, Bounced, Failed, Skipped. Messages sent without a template are grouped in the No template row.
- Skip and failure reasons: for example, not subscribed, frequency limit, no recipient address, template error, plan quota or brand suspended.
- Unsubscribe sources: unsubscribe link, bounce, /stop in Telegram, manually, and others.
Open and click rates are calculated from sent messages. Test sends aren't included in the report. Opens are counted where the channel can track them, such as in emails. Clicks are counted on links that OneTrace.pro replaces with its own to track clicks.
Message statuses
| Status | What it means |
|---|---|
| Queued | The message is waiting to be sent |
| Scheduled | The project's quiet hours are in effect; the message will be sent when they end |
| Sent | The channel accepted the message |
| Delivered | The provider confirmed delivery |
| Skipped | The message wasn't sent: no subscription, a frequency limit was hit, there's no address, or the quota is used up |
| Failed | Sending failed even after retries, or the integration is unavailable |
| Bounced | The email bounced, and the address was unsubscribed from email |
To learn how to set up subscriptions, frequency, and quiet hours, see Messaging rules.
Messages for a specific customer
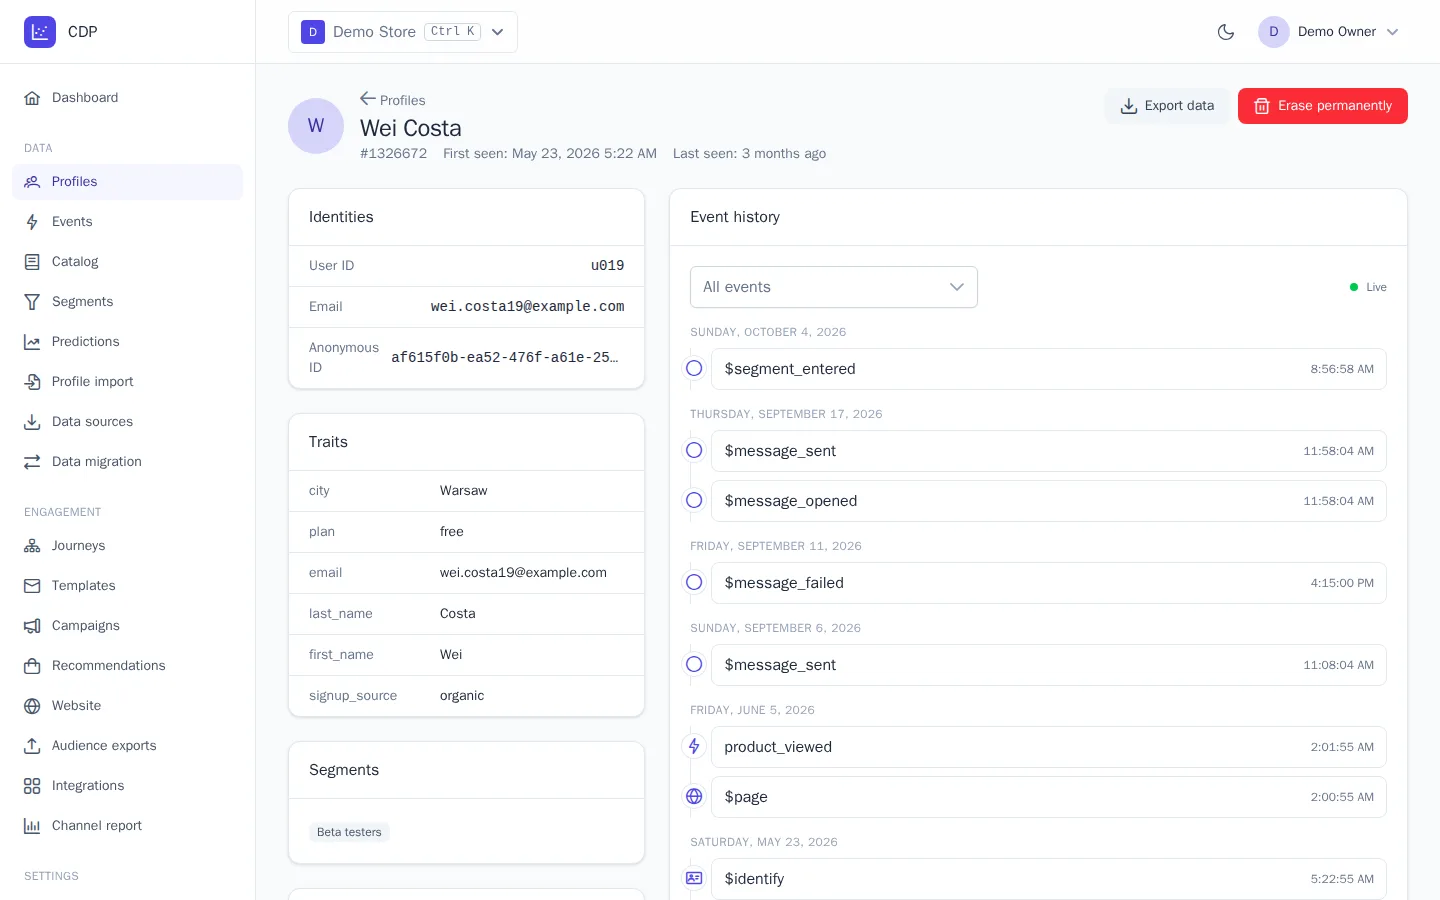
To find out why a customer didn't get an email, open their profile in Data → Profiles. The Messages card lists all of their messages with the subject or template name, status, date, and integration. It also shows whether the message was opened, whether a link was clicked, and the reason for a skip or failure. Test sends are marked test.
You can also send a message manually from this card with the Send message button. This is available to the Manager role and above. Manual sends also check subscriptions, frequency, and quiet hours.