ROPO report
ROPO (research online, purchase offline) means "researched online, bought in a store". The report shows how many sales in your stores were made by customers who had visited your website, viewed a product, or clicked an email beforehand. This way you can see how much in-store revenue online marketing brings in, even though there was no order on the website. Reverse ROPO shows the opposite movement: online orders after a purchase in a store.
Open Analytics → ROPO and click New report. The report is available on the Growth plan. See Plans. The period, profile filter, report link, saving, and CSV work the same way as in other reports. See Common to all reports.
What the report needs
- Checks from stores in OneTrace.pro. You can send them through the API, a data source, or the 1C extension, or upload them as a file. See Stores and in-store sales.
- The in-store purchase rule: how to tell a store check from a website order. By default, it is the purchase event with the property
channel = offline. You set the rule in Data → Stores, and the report shows which rule is in effect. - The purchase event and amount: the same as in the Revenue report, from the prediction settings or the ones chosen at the top of the Revenue page.
- For the products block, you need a product view event in the recommendation settings.
A customer in a store and on the website must be the same profile. If a check has a phone, email, or loyalty card, OneTrace.pro finds the profile that has it. When the customer leaves the same phone or email on the website, their online history and checks are joined. See Profile merging.
Online touches and the window
An online touch is an action by the same customer before the check:
| Touch | What counts | Source in the report |
|---|---|---|
| Visits | a website visit: the first event after a break of more than 30 minutes | the traffic channel: search, paid search, email, social, direct: as in traffic sources |
| Product views | a product view event | none |
| Message clicks | a click on a link in an email, SMS, or another message | the message channel |
The window is how many days before the check to look for touches: 1, 3, 7, 14, 30, 60, or 90 days (30 by default). A check with at least one touch in the window is a check with a touch. You can turn off kinds of touches with the checkboxes: for example, keep only product views.
Metrics
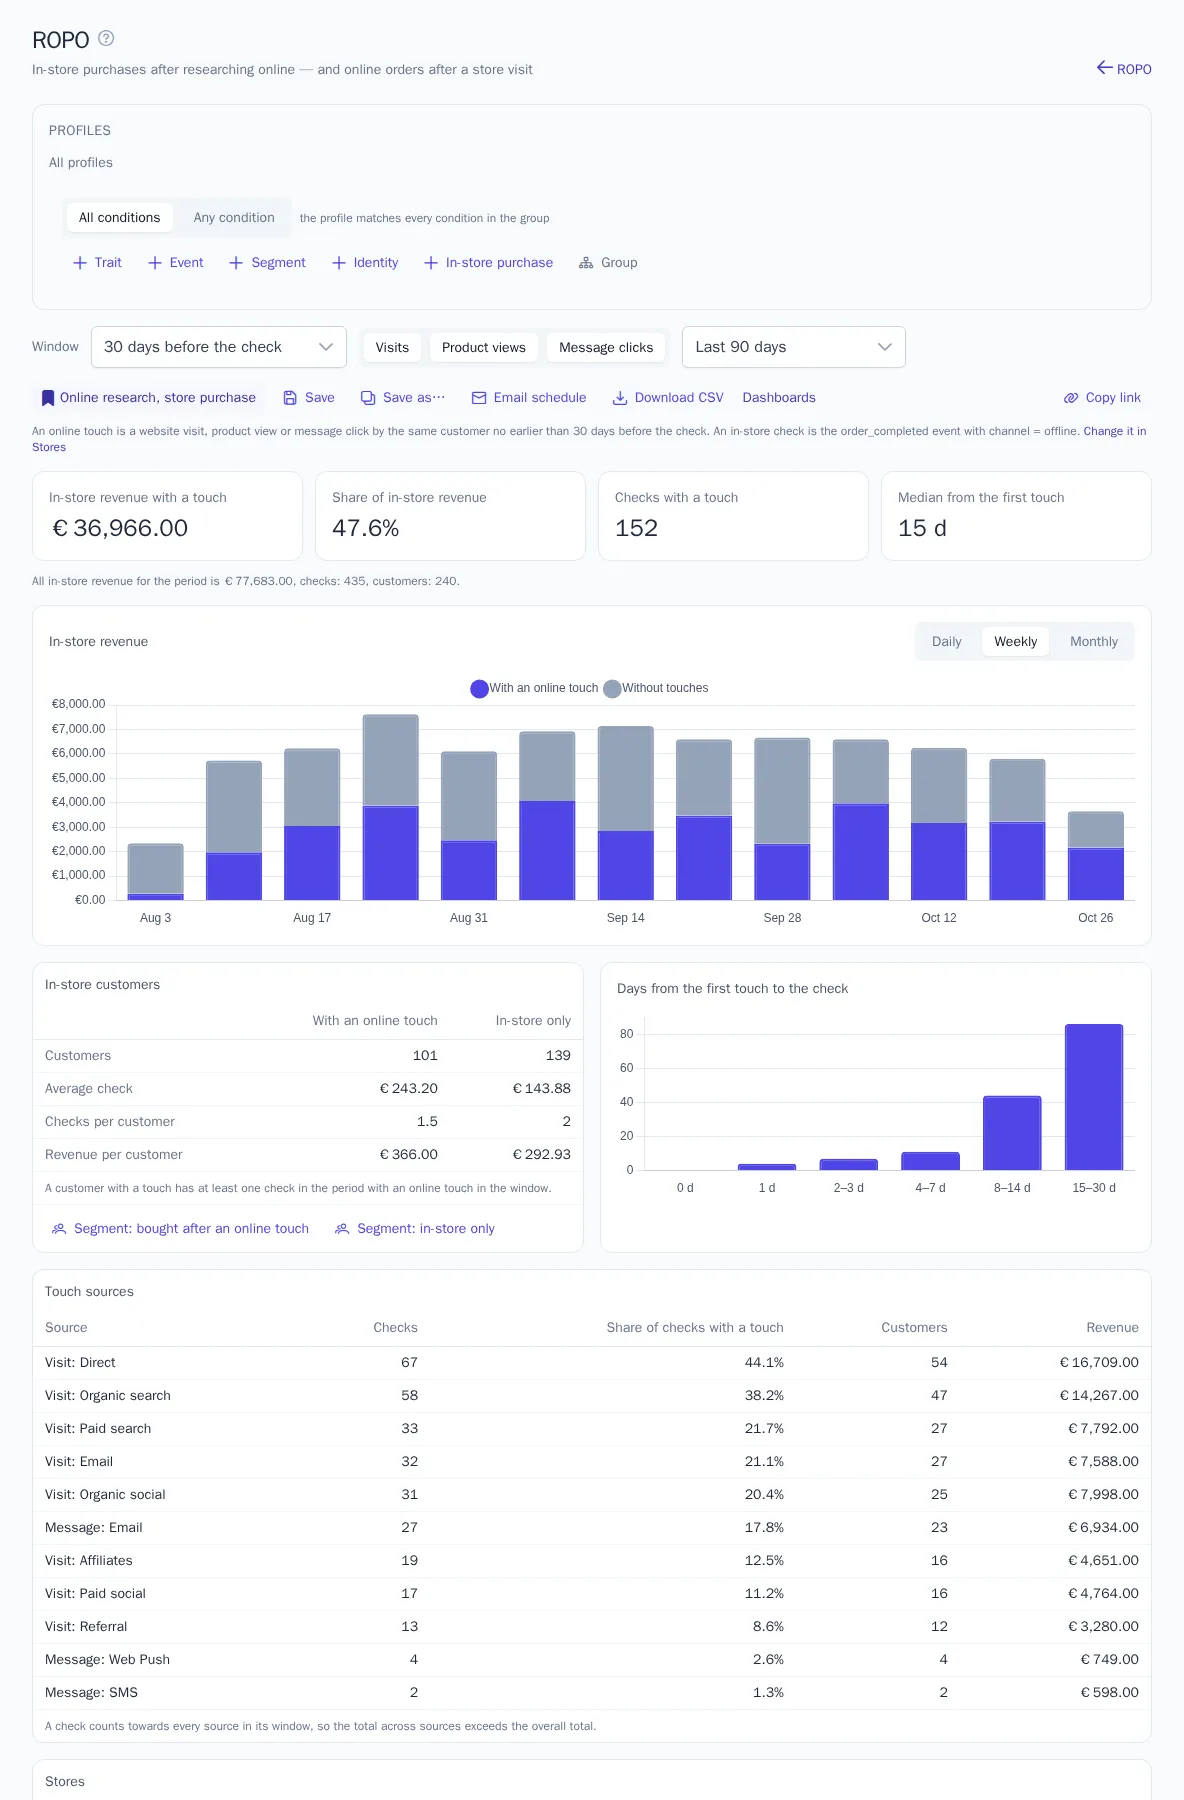
- In-store revenue with a touch and Checks with a touch: the amount and the number of checks that had an online touch before them.
- Share of in-store revenue: the part of all store revenue that came from checks with a touch.
- Median from the first touch: how many days usually pass from the first touch in the window to the purchase.
- Below the metrics: all in-store revenue for the period, the number of checks, and the number of customers.
The chart splits in-store revenue by day, week, or month into checks with a touch and checks without touches.
In-store customers compares two groups. Customers with a touch have at least one check in the period with a touch. The others are In-store only. For both groups, you see the number of customers, the average check, checks per customer, and revenue per customer. The comparison shows whether customers who research a product online first spend more.
Days from the first touch to the check shows how many checks with a touch were made on the same day, the next day, a week later, and later.
Touch sources
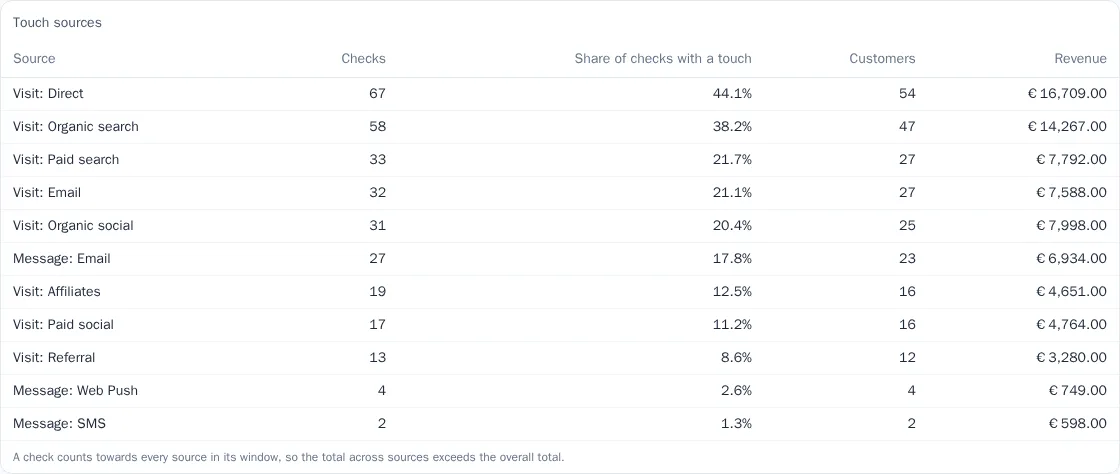
The table shows which channels come before purchases in a store: "Visit: Organic search", "Visit: Paid search", "Visit: Email", and message clicks by message channel. For each source, you see checks, the share of checks with a touch, customers, and revenue. If a check was preceded by both a visit from search and an email click, the check is counted in both sources, so the total across sources is larger than the overall total.
Stores
For each point of sale: checks, revenue, the share of checks with a touch, and the average check with and without a touch. The Online after the store column shows online orders placed by customers who had been in this store. Names and cities come from the store list. If a store isn't in the list, the report shows its id marked "not in the directory".

Viewed online, bought in store
Products from checks that the customer had viewed on the website within the window. For each product, you see the number of such checks, all checks with this product, and their share. Products in a check come from the products list of the purchase event or from the product property (as in the Revenue report). Product ids in checks must match the ids in the catalog and in product view events.
Reverse ROPO
Online orders that the same customer placed after buying in a store within the window: they saw the product on the shelf and ordered it on the website. The report shows the revenue of such orders, their share of all online revenue, and the number of orders and customers.
Segments and journeys
The buttons under the customer comparison create a dynamic segment:
- Segment: bought after an online touch: customers with checks with a touch;
- Segment: in-store only: store customers without online touches, for example for a campaign that brings them to the website.
The segment gets an In-store purchase condition with the report's period, window, and kinds of touches, and then it is recalculated on its own schedule. You can add the same condition to any segment by hand. See Segments. A journey for a store purchase is started by the In-store purchase trigger. See Journeys.
Saving, dashboards, and API
Click Save to save the report. You can add it to a dashboard as a card, export it to CSV, and get it by email on a schedule.
A report for a large project, where the period and window contain more than a few million events, is calculated in the background. The page shows "Calculating the report…" and refreshes on its own, usually within a minute or two. The finished result is kept for 5 minutes. A CSV of such a report can be downloaded when the calculation is finished.
The same report is available in the API: POST /api/v1/analytics/ropo with a secret key. See API keys. If the report is still being calculated, the API responds with 202 and a Retry-After header: repeat the request after the given number of seconds.